


The National Institute for Health and Care Excellence (NICE) is the body responsible for recommending medicines for use within the National Health Service (NHS) in England.
Key takeaways
- High Proportion of Optimised Decisions: NICE categorises 84% of its recommendations as positive, but 36% of these positive decisions since 2000 have been ‘optimised’. Optimised decisions often limit patient access by recommending the use of medicines for a smaller population than indicated in their marketing authorisation.
- Decrease in Patient Access: The mean M score for optimised decisions between January 2023 and December 2024 was 31%, indicating that, on average, each optimised decision by NICE provides access to 31% of the total population for which the medicine is indicated in its marketing authorisation. This is a decrease compared to previous periods (45% for 2020-2022 and 39% for 2015-2019).
- Trend of Increasing Optimised Decisions: The proportion of optimised decisions has been increasing over time, with 47% of positive decisions in the study period being optimised compared to 32% in 2015.
One component of this is NICE’s Technology Appraisal (TA) programme, wherein NICE assesses the cost- and clinical-effectiveness of medical technologies and makes recommendations accordingly.
NICE states that 84% of its recommendations are positive. These include recommendations, optimised recommendations, and recommendations allowing use through the Cancer Drugs Fund (CDF) and Innovative Medicines Fund (IMF). Optimised recommendations, which account for 36% of positive decisions since 2000 (excluding CDF), often apply to narrower patient populations than those covered by a medicine’s full marketing authorisation.
The aim of this report is to describe how NICE’s optimised decisions impact patient access to medicines from January 2023 to December 2024. Using the M-score methodology developed by O’Neill and Devlin (2010), we assess the proportion of the licensed population that is recommended for treatment in each case.
Between January 2023 and December 2024, NICE made 135 positive decisions, of which 64 (47%) were labelled as optimised, excluding CDF decisions. This result is consistent with the long-term trend of optimised decisions increasing as a proportion of positive decisions. Of the 64 optimised decisions made by NICE, 56 were carried forward for our analysis, and of those, 30 (47%) included sufficient information to allow for the estimation of M scores.
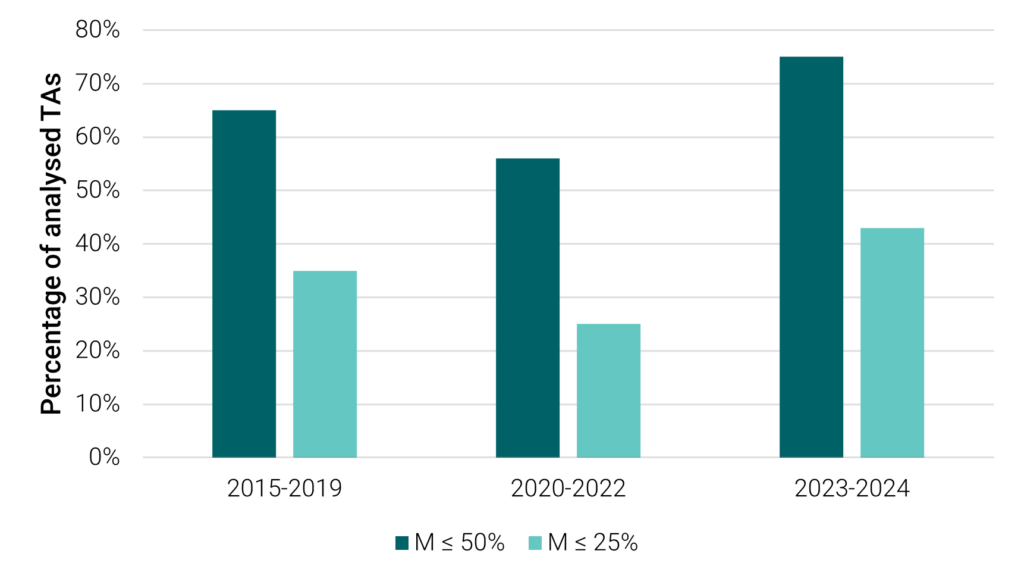
Among those 30 TAs, the mean M score was 31%, meaning that, on average, each optimised decision by NICE provides access to 31% of potential candidates for treatment, which compares to average M scores of 45% and 39% for the periods of 2020-2022 and 2015-2019, respectively. Moreover, we found that 77% of TAs recommended treatment for under half of the eligible patient population, with 43% having M scores below 25%. Between 2020 and 2022, these figures were 56% and 25%, and between 2015 and 2019, they were 65% and 35%. Figure 1 presents a visual representation of these changes.
M-scores below 50% and 25% from previous OHE analyses
The average level of patient access was particularly low for the following disease areas: infections (average M score 8%); neurological conditions (average M score of 15%); and diabetes and other endocrinal, nutritional and metabolic conditions (average M score of 17%). Medicines for digestive tract conditions, skin conditions, and eye conditions, in contrast, had average M scores over 50%.
The findings suggest that optimised recommendations are being used more frequently and often apply to narrower populations than in previous years. However, the underlying reasons for this trend are likely to be multifactorial. NICE’s committees may issue optimised decisions when they conclude that use is only justified in particular subgroups based on available evidence or cost-effectiveness considerations. In other cases, narrower population definitions may originate from company submissions.
This analysis does not assess the appropriateness of individual optimisation decisions but offers a descriptive view of how treatment access recommendations align with marketing authorisations. Further research could explore the drivers behind this evolving pattern, including how evidence generation, submission strategies, and appraisal methodologies contribute to these outcomes.
This consulting report, An Analysis of NICE’s Optimised Decisions from 2015 to 2024, was commissioned and funded by The Association of the British Pharmaceutical Industry (ABPI).