Unlocking the Value of Combination Therapies

Professor Nancy Devlin outlines her top 5 recommendations for anyone collecting or reporting EQ-5D data. Written by Professor Nancy Devlin, Director of Research at OHE and member of the EuroQol Group EQ-5D is the most widely used measure of patient…
Professor Nancy Devlin outlines her top 5 recommendations for anyone collecting or reporting EQ-5D data.
Written by Professor Nancy Devlin, Director of Research at OHE and member of the EuroQol Group
EQ-5D is the most widely used measure of patient reported outcomes (PRO) around the world. For a couple of decades now, it has been used in clinical trials, observational studies, population health surveys and – more recently – in routine data collection in health care systems. Because it’s a generic PRO, and because it is accompanied by ‘value sets’ (a.k.a ‘utilities’) used in the calculation of QALYs (quality adjusted life years), EQ-5D has become the cornerstone of health technology appraisal (HTA), affecting important decisions about access to new medicines.
But despite all that, EQ-5D data are often under-reported, and inadequately analysed. The bottom line is – if you collect these data from your patients, you should be committed to making sure you learn as much as possible from what they tell you.
So: for anyone collecting or reporting EQ-5D data, here are my recommendations for what to do with EQ-5D data. This applies to the original three-level version, the EQ-5D-3L; the five-level version, EQ-5D-5L; the child-friendly version, EQ-5D-Y – and arguably, any PRO instrument.
1. What not to do – don’t skip straight to ‘utilities’ or use of scores of any kind to summarise patients’ data
OK: you’ve collected EQ-5D data. That’s great for lots of reasons! The EQ-5D is a fantastic way of measuring health outcomes in a generic way that can be compared across disease areas. A bunch of patients/people have ticked boxes to describe their health on the five dimensions. A common approach is to summarise those responses into a single number on a scale anchored at 1 (full health) using the value sets that are available for that purpose (Szende et al 2007). It makes analysis of the data a lot easier: after all – statistically, single numbers are easier than categorical data.
Job done? Wrong!
You should know that:
Note – none of this is a criticism of EQ-5D – if anything, the opposite! The EuroQol Group is open about these sorts of issues and has extensively researched them. All other generic and condition specific PROs have the exact same problems – they just don’t say much about it.
2. Look at patients’ responses to the question items (dimensions)
Don’t underestimate the importance and usefulness of good, old fashioned descriptive statistics! Descriptive statistics on PRO data are undervalued and underreported in papers, which is a shame.
Summarising EQ-5D data by the value sets doesn’t tell you much about which aspects of patient or population health have been most affected by their condition, or improved by treatment. To know about that, you need to look at the data that patients have actually given you: the boxes they have ticked on the EQ-5D questions. For example, you should always report the number and percentage of patients reporting each level of problem on each dimension of the EQ-5D. If you want to simplify things, you can also collapse levels 2 and 3 together, and report the number reporting ‘no’ problems, and the number reporting ‘any’ problems.
In addition to describing patient health at one point in time, you may be interested in describing the changes in patient health – for example, before or after surgery, or at various time points in a clinical trial, compared to baseline.
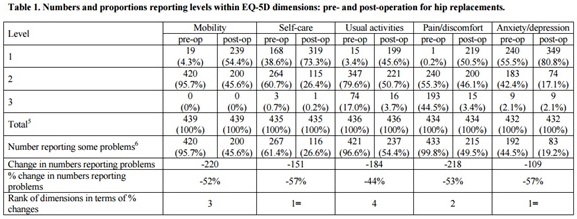
This too can be done at the level of the EQ-5D dimensions. Again – descriptive statistics can tell you a lot. For example, when we looked at the change in the number and percentage of NHS hip replacement patients reporting problems by dimension (see Table 1 below), before and after surgery, we found that there were quite striking improvements in patients’ anxiety and depression, self-care and pain/discomfort – not just mobility (Devlin et al 2010). In fact, what was striking was that no patients had a ‘level 3’ on mobility before surgery, so the only improvements possible as a result for surgery were from ‘some’ to ‘no’ problems. The reason? Level 3 on the EQ-5D-3L mobility dimension is ‘confined to bed’ – and even patients with very poor mobility because of hip problems aren’t stuck in bed. That’s a problem with the EQ-5D-3L – as we have pointed out previously (Oppe et al 2011) – and has been corrected in the new EQ-5D-5L (Herdman et al 2014). None of these things would have been apparent if these patients’ data had been analysed just in terms of the utilities.
Source: Devlin et al (2010)
3. Summarising change without using value sets
Tables like the one shown above can be very informative – but are complicated to look at, and sometimes an overall summary is required. The good news is that it is easy to summarise changes in EQ-5D health status, just using the data patients have given you.
In 2010, we came up with a way of doing that, based on the principles of a Pareto improvement in Welfare Economics – the Pareto Classification of Health Change (PCHC) (Devlin et al 2010). The idea is simple: an EQ-5D health state is deemed to be ‘better’ than another if it is better on at least one dimension, and is no worse in any other dimension. And an EQ-5D health state is deemed to be ‘worse’ than another if it is worse in at least one dimension, and is no better in any other dimension. Using that principle to compare a patient’s EQ-5D health states between any two time periods, there are only 4 possibilities:
– Their health state is better
– Their heath state is worse
– Their health state is exactly the same
– The changes in health are ‘mixed’: better on one dimension, but worse on another.
Applying this to the hip replacement data, we found less than 5% had no change, 82% had improved health, less than 5% had worse health, and under 10% had a ‘mixed’ change (Devlin et al 2010). In other words, this simple analysis provides a very clear summary of what is happening to patients’ health as a result of hip surgery – without relying on value sets. It also highlighted important differences in the benefits from hip surgery, compared with other types of elective surgery.
There are also other ways of summarising EQ-5D data. I won’t go into them all here – but there are a variety of approaches, and some have important limitations as a way of summarising patients’ data. An example of the latter is to approximate the overall ‘severity’ of a state by its ‘level sum score’, which simply adds up the levels on each dimension. The best EQ-5D-3L health state involves having no problem on any dimension. ‘No problem’ = 1, so no problems at all (1+1+1+1+1) = 5. The most severe problem on any dimension = 3, so the worst health state is (3+3+3+3+3) = 15. Every other health state on the EQ-5D-3L will have a level sum score between the best (5) and the worst (15). This can also be applied to the EQ-5D-5L, where the best is again 5, and the worst is (5+5+5+5+5) = 25. These level sum scores can be useful in some situations– but there are obvious limitations. It’s a very crude summary score – for example, 22222, 33211 and 11233 all have the same level sum score (= 10). And each score contains a very different number of potential profiles (5 and 15 have just one profile each; whereas level sum score 10 contains 51 profiles). Also, just because it weights the dimensions equally doesn’t mean it is ‘value judgement free’ – equal weighting of dimensions in itself represents a view about their importance (Parkin et al 2010).
4. Use your EQ-VAS data!
The EQ-VAS is a 0-100 scale where patients are asked to indicate their overall health today. We (speaking here as a member of the EuroQol Group!) regard it to be an integral part of the EQ-5D questionnaire – but is often completely overlooked and unreported (or worse still – some users drop it from data collection, even though it is a part of the copyright instrument!). The EQ-VAS offers important, complementary information to the health state information patients provide when they self-report their health on the EQ-5D. In fact, the EQ-5D is unique as a PRO instrument in generating data showing patients’ own, overall assessment of their health. Not someone else’s view of how good or bad their overall health state is, if they imagine being in it, but the view of the person actually experiencing it. That sounds like useful information – and it is.
For example, the EQ-VAS can capture problems that aren’t captured within the 5 dimensions of the EQ-5D – potentially revealing some gaps in the EQ-5D relevant to particular patient groups (see Feng et al 2014). This helps to interpret the EQ-5D data you’ve collected, and whether there might be any reason to suggest it does not fully capture the effects of health problems.
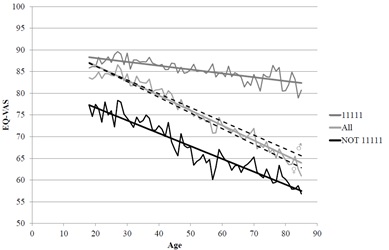
Not convinced? Take a look at this diagram, which has been generated from the vast amounts of data held by the EuroQol Group. There is a sharply declining EQ-VAS by age for those who report problems on the EQ-5D (i.e as age increases, so do the problems reported on the five dimensions and so too does patients’ overall self-assessed health on the EQ-VAS). But interestingly, EQ-VAS declines with age, even among patients reporting no problems on the EQ-5D. This suggests the EQ-VAS is measuring something a bit different to, and additional to, the things in the 5 dimensions.
5. Last but not least: if you do need to use a value set to summarise your EQ-5D data – e.g., for estimating QALYs – make sure you do sensitivity analysis to alternative value sets.
Value sets are a product of researchers’ decisions about what methods to use, and how to model to data. Those decisions can potentially have a non-trivial effect on the characteristics of the values that are generated – for example, what the minimum value is, and how many negative values there are, and what the distribution of the values looks like. There is a lack of consensus among researchers about what methods are ‘best’, and different methods, both for eliciting values and modelling them, can lead to different results.
The implication is that the values to be applied to EQ-5D data have some uncertainty associated with them. But then, so does the evidence on lots of other things in cost effectiveness analysis, like the effectiveness of new technologies, and their costs. So – just like any other uncertain parameter in a cost effectiveness model, the implication is that analysts should make sure they check whether their conclusions about cost effectiveness are sensitive to the choice of the value set. And, where value sets report confidence intervals (which they all should!) those confidence intervals should also form part of the sensitivity analysis in cost effectiveness analysis.
Want to know more? Selected references:
Devlin N, Parkin D, Browne J. (2010). Using the EQ-5D as a performance measurement tool in the NHS. Health Economics 19(8):886-905.
Parkin D, Devlin N, Rice N. (2010) Statistical analysis of EQ-5D profiles: does the use of value sets bias inference? Medical Decision Making 2010; 30:556-565